Graphing Picture and Bar Graphs
Procedure
Activate and Assess Prior Knowledge
To capture student attention the teacher begins discussing the recent data collection of pockets worn by classmates for seven days. Students have excitedly counted the number of pockets worn by their peers and together with the teacher have created a “T chart” with the day, number of pockets, and the number of students each day. The teacher emphasizes the vocabulary word “data” to show that it is the number of items counted.
Anticipatory Set
Objective #1: Students sort and count objects to graph with correct representation and quantification as indicated on the 3-4 point accuracy on the Graph Rubric.
The teacher uses the “Graphs” PowerPoint Presentation (PPP) to introduce (slide 2):

What is a graph?
How is it used?
Why is it used?
Modeling
Objective #1: Students sort and count objects to graph with correct representation and quantification as indicated on the 3-4 point accuracy on the Graph Rubric.
“Graphs” PPP (slide 3 & 4)
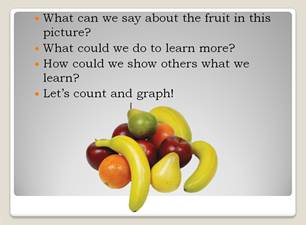
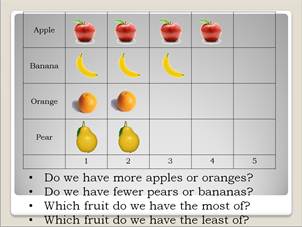
The students decide how to sort the fruit and how many of each fruit there are. Then a picture graph is created to show the results.
Students answer the questions:
Do we have more apples or oranges?
Do we have fewer apples or bananas?
Which fruit do we have the most of?
Which fruit do we have the least of?
Guided Practice
Objective #1: Students sort and count objects to graph with correct representation and quantification as indicated on the 3-4 point accuracy on the Graph Rubric.
“Graphs” PPP (slide 6)
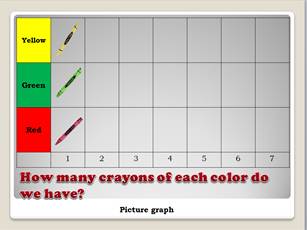
A picture graph is compiled after students sort and count crayons.
“Graphs” PPP (slide 7)
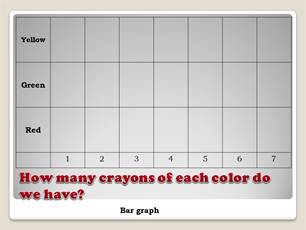
A bar graph is compiled after students have created a picture graph to represent the sorted and counted crayons.
Each student has a chance to work on the Smartboard.
Closure
Objective #1: Students sort and count objects to graph with correct representation and quantification as indicated on the 3-4 point accuracy on the Graph Rubric.
The students have been keeping record of how many pockets they have worn for seven days.
"Graphs" PPP (slide 8)

With the teacher’s guidance students create a bar graph and then answer questions.
- On which day did we have the most pockets?
- Did we have the same amount of pockets any day? Which ones?
- What day did we have the least amount of pockets?
- How many more pockets did we have on day 2 than day 5?
- How many less pockets did we have on day 1 than day 7?
Independent Practice
Objective #2: Students create a picture graph of cubes after counting and sorting them with 3-4 points total accuracy on the Graph Rubric.
Students receive a handful of 4 different color cubes. They sort, count and create a picture graph depicting the correct number of each.
Objective #3: Students create a bar graph using M&Ms after counting and sorting them with 3-4 points total accuracy on the Graph Rubric.
Students receive a fun size bag of M&Ms. They sort, count and create a bar graph depicting the correct number of each.
Culminating Activity:
Select students share their independently completed picture or bar graph with the class.
Extension Activity: Students collect class data on students’ favorite ice cream flavors, sport, and color. Students then decide to create a picture graph or bar graph after sorting and counting the data. The graphed results are checked, corrected, and then displayed. The data is collected collectively but students independently create their graphs.
Technology Portion:
Smartboard: PowerPoint Presentation and interaction.